It sure gets quiet around here between issues of the Polaris Letter, so I thought I would add something for our free subscribers. There is a lot of excellent commentary out there, including a few things that I want to highlight as I think they are important and add supporting detail to the issues we’ve been following in PL. So, basically it is “recommended reading.”
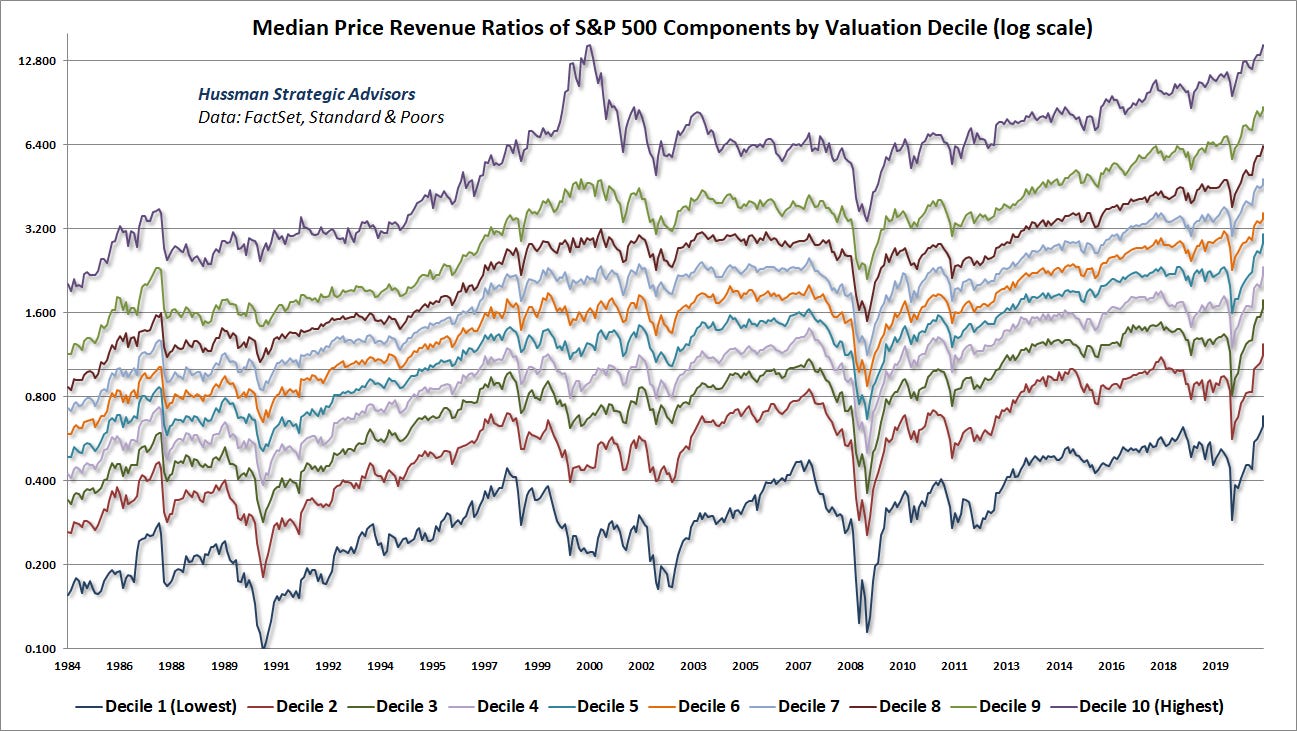
I have been a fan of John Hussman’s online commentary (available free here). He is very precise and diligent about a few important topics — mostly, valuations and implied future returns. Recently, he looked into the Price/Sales ratio of SP500 companies, divided by deciles — the 10% highest p/s companies, the lowest 10%, and all the slices in between. This gives a picture not only of the market as a whole (the average p/s ratio), but also its components. Back in 1999-2000, a few sectors were very expensive, but a lot of the market was quite cheap. Today, everything is expensive.
The price/sales ratio is particularly illustrative, because price/sales is basically price/earnings X earnings/revenue (the profit margin). In other words, it normalizes for profit margins. We are not fooled by very high, unsustainable profit margins, perhaps during a boom, or very low profit margins, as in a recession. Also, it naturally includes things like overseas revenues for multinationals.
You can see how in 2000, the lowest five deciles were not real expensive, actually matching valuations from the mid-1980s. Valuations rose up into 1997 and then got whacked in the crisis that year (the Asia Crisis, LTCM and Russian default), and never really recovered. Basically, what happened (in my opinion) is that investors looked around for “what’s working,” and seeing a smoking crater in the once-hot EM markets, and sagging operations in old-line economy companies, poured into the profitless tech sector for a speculative party.
Today, we have the highest valuations ever in all ten deciles. This is a log scale, so each horizontal line represents a doubling of price/sales valuations. In other words, if a company had more-or-less flat sales (NGDP growing in low single digits these days), and the price/sales valuation dropped in half, that implies that the stock price dropped in half. All of these deciles look about “one line” (100%) too high to me. In a really bone-crushing bear market, they could go about “two lines” (75%) lower. Then, they would finally be good investments, and I would be here talking about how these valuations should be about “one line” higher.
Unfortunately, valuation work like this is not so good for timing, since something becomes very expensive by becoming expensive and then going much higher; and something becomes very cheap by becoming cheap and then going much lower. The trend doesn’t turn just because you happened to notice it one day. However, as people like Jeremy Grantham have noted, there are a number of clues that suggest a turning point is likely this year; and, perhaps, is already behind us.


